Season analytic summary
Analytics are broken into two categories: game stats and playing stats.
Game stats look at our aggregate performance in competition. They measure as a proxy how we perform against competition as whole. We can use them to infer strengths and weaknesses in terms of offense and defense.
Playing stats look at our ability to make shots as called. These are available aggregated at the team level, and individual levels down to shot type, and position. These stats help us understand strenghts and weaknesses of each player. They also help us understand the kind of shot distribution that is typical of each position based on the strategy we are calling as a team. When looked at in aggregate (i.e. team shooting percentage) these stats show the effect of moving players to different positions.
Key game stats
| Metric | All | WCT | Non WCT |
|---|---|---|---|
| Wins | 33 | 6 | 27 |
| Losses | 8 | 7 | 1 |
| HE | 0.46 | 0.32 | 0.53 |
| SD | 0.25 | 0.36 | 0.18 |
| FE | 0.25 | 0.25 | 0.25 |
| SE | 0.33 | 0.28 | 0.34 |
| BR | 0.13 | 0.23 | 0.07 |
| PF/G | 7.78 | 5.28 | 8.96 |
| PA/G | 4.07 | 6.23 | 3.07 |
| EF/G | 3.82 | 3.91 | 4.10 |
| EA/G | 2.85 | 3.84 | 2.39 |
| PF/E | 0.94 | 0.65 | 1.08 |
| PA/E | 0.49 | 0.77 | 0.37 |
| BE/G | 1.04 | 0.38 | 1.35 |
Lineup analysis
| Lineup | Event Type | Percent (%) |
|---|---|---|
| NEMS | ALL | 68.7 |
| NEMS | WCT | 61.3 |
| NEMS | No WCT | 77.9 |
| -------- | -------- | ------ |
| LNMS | ALL | 67.8 |
| LNMS | WCT | 65.6 |
| LNMS | No WCT | 73.7 |
| -------- | -------- | ------ |
| LENS | ALL | 66.8 |
| LENS | No WCT | 66.8 |
| -------- | -------- | ------ |
| LEMS | ALL | 66.3 |
| LEMS | WCT | 59.5 |
| LEMS | No WCT | 70.0 |
Lineup legend
Abbreviation and description for lineups starting in playing order lead to skip. The column 'Effect of NOT on ICE' indicates the lineup is measuring the relative performance of the team lineup without that player. When we see differences between lineups we are measuring a proxy the contribution of that missing player to the overall team shooting percentage.
| Lineup | Players | Effect of NOT on ICE |
|---|---|---|
| NEMS | Nico, Edu, Mikel, Sergio | Luis |
| LEMS | Luis, Edu, Mikel, Sergio | Nico |
| LNMS | Luis, Nico, Mikel, Sergio | Edu |
| LENS | Luis, Edu, Nico, Sergio | Mikel |
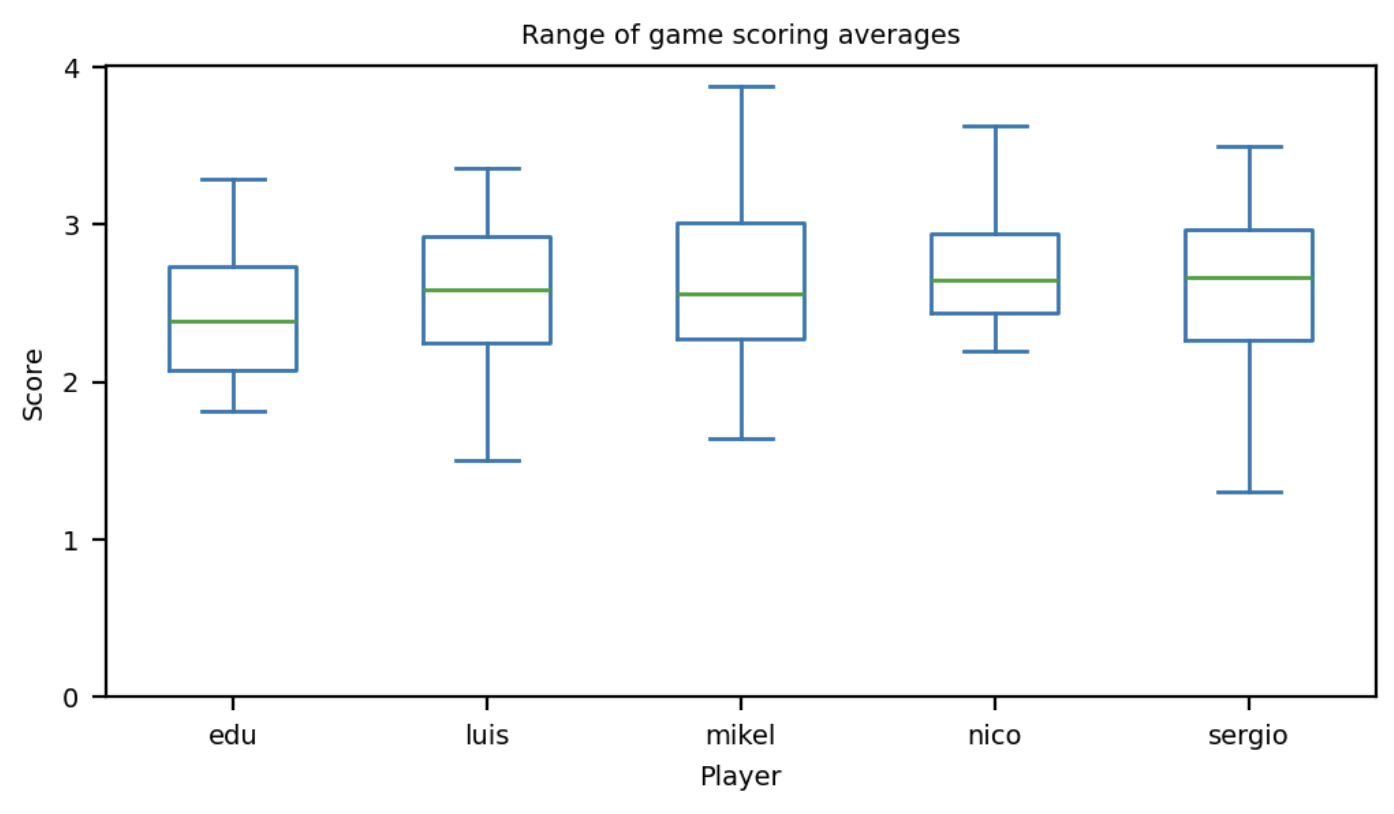
Game averages
A measure of each players total performance per game. Box plots display game averages by quartiles with the green line representing the median performance.
All events
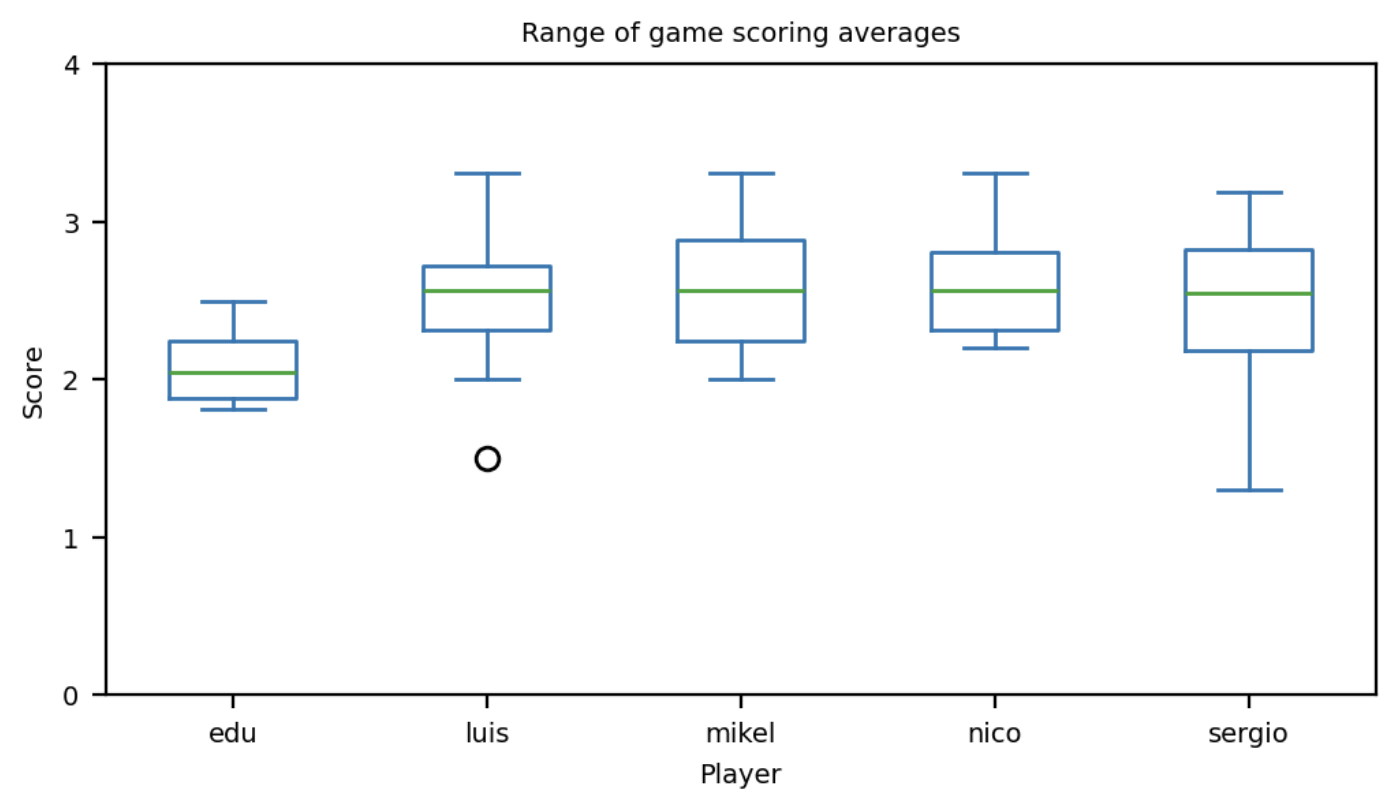
WCT
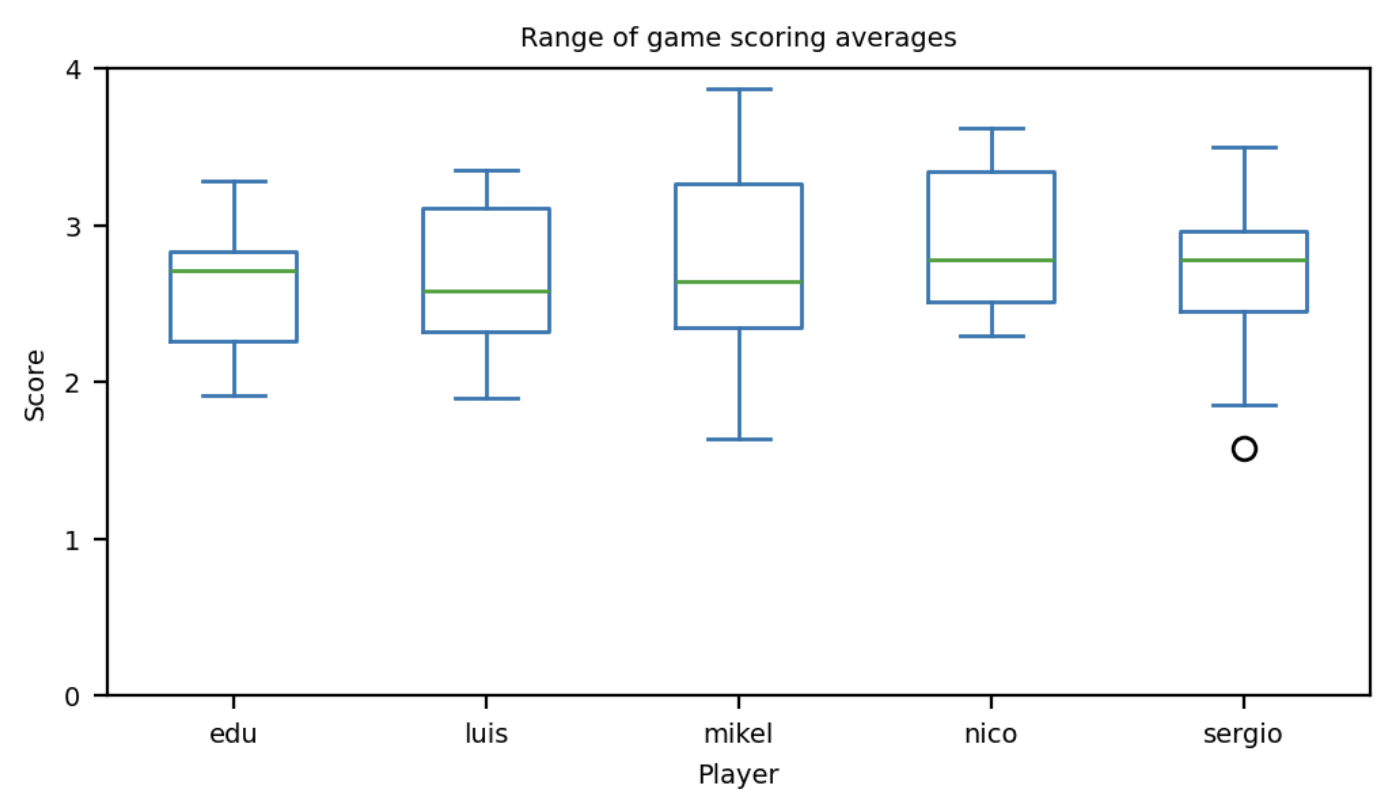
Non WCT
Score counts
Following score counts show the frequency of a given numerical score per player. Graphic below is for all event types and includes all positions a player has played.
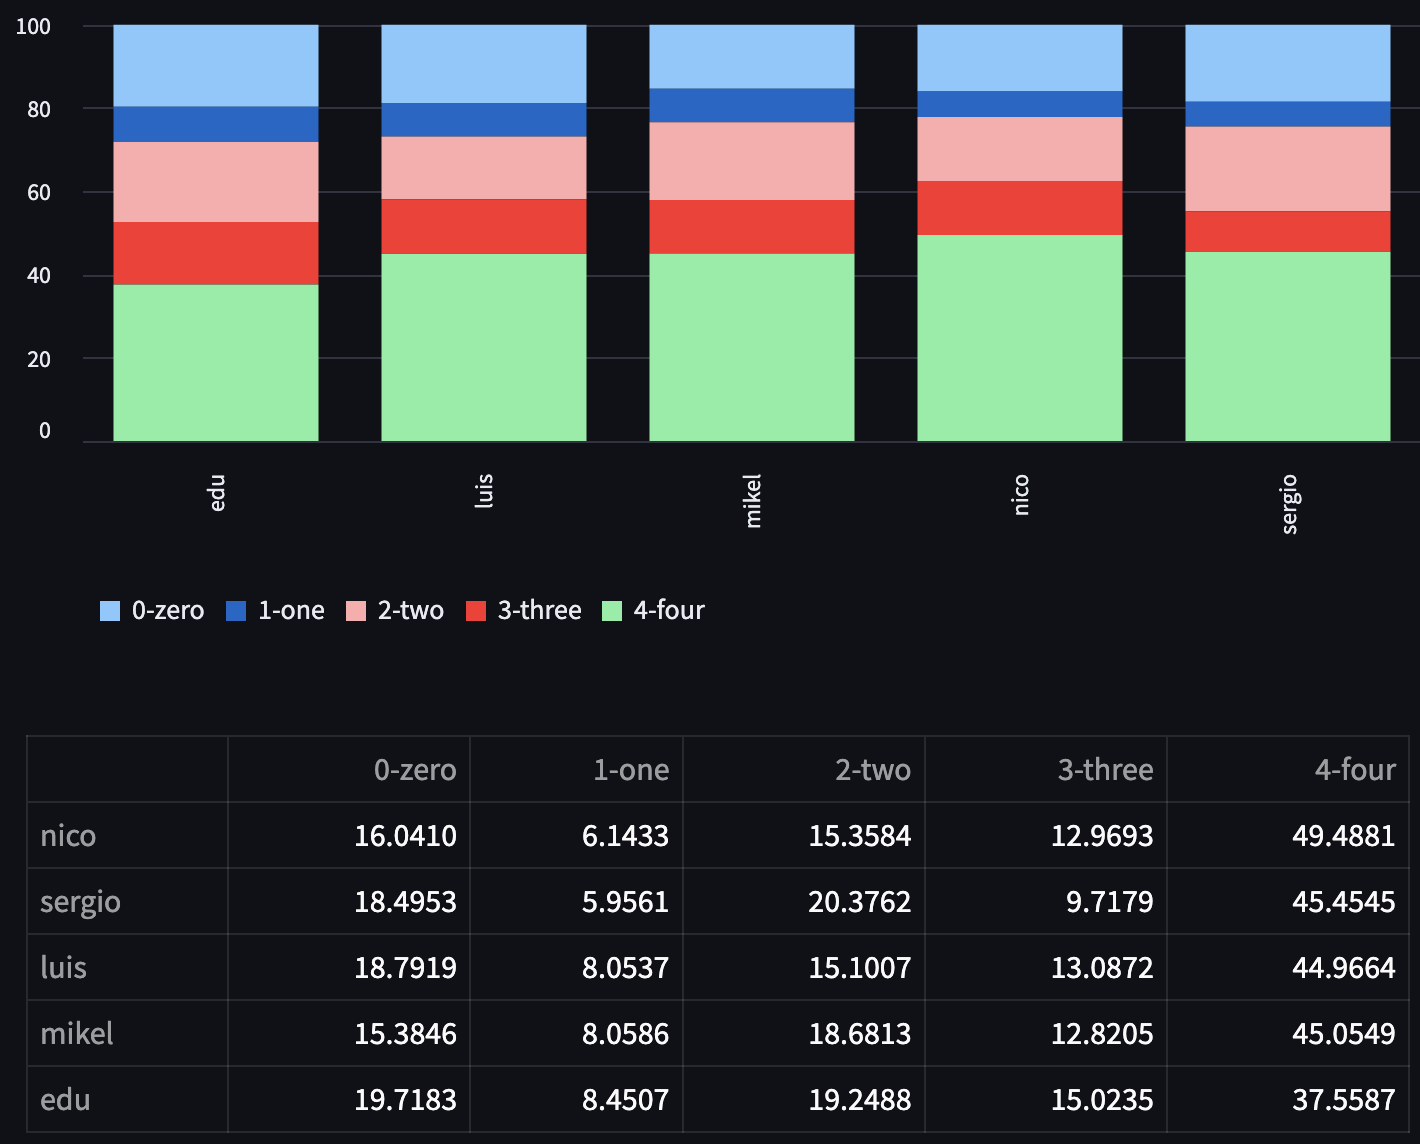 Note: Players numbers cover multiple positions. See Lineup score count analysis for details on counts from specific positions.
Score count breakdowns
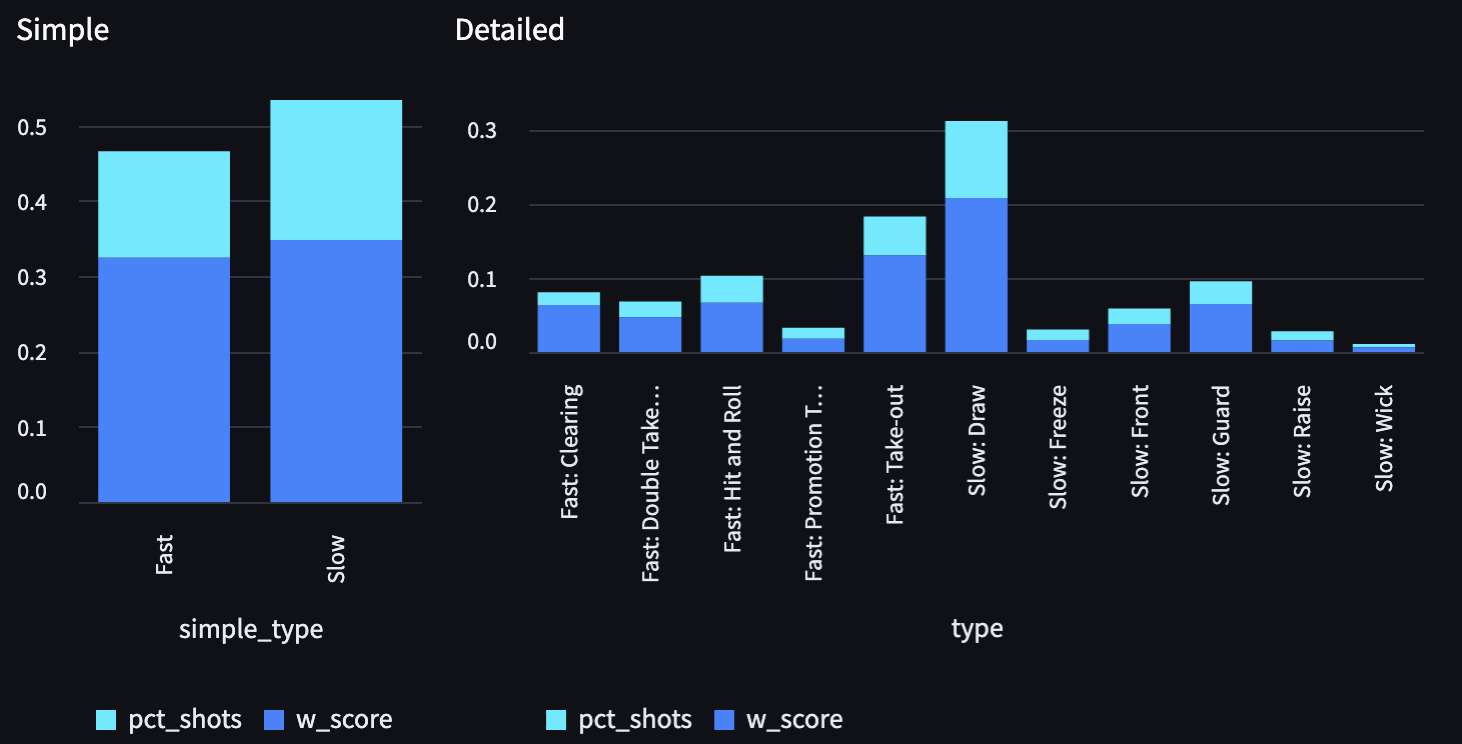
Team shot distributions